
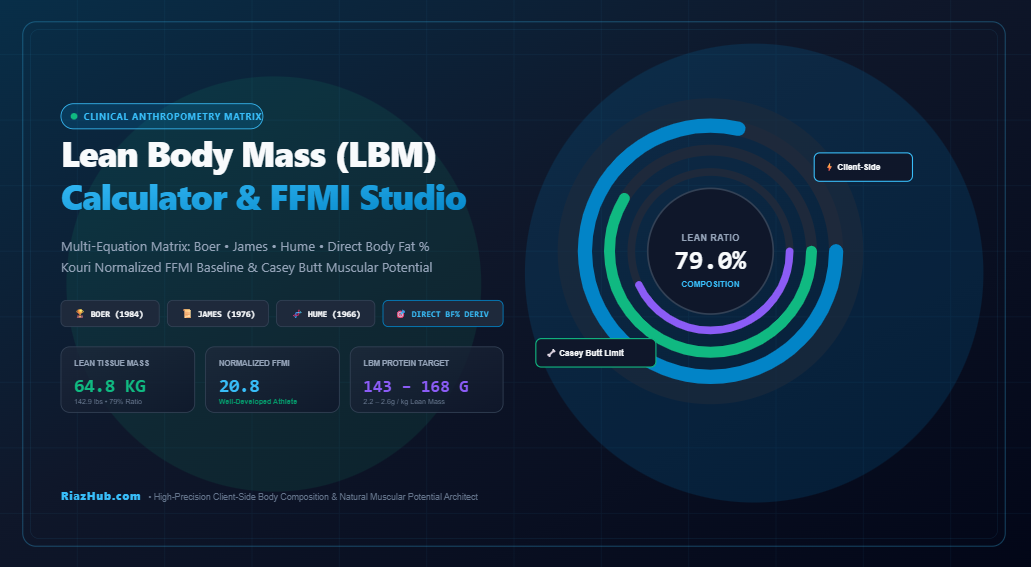
Mastering Lean Body Mass (LBM) & FFMI: The Clinical Science of Body Composition Partitioning
Total scale weight is one of the most misleading biometric data points in clinical healthcare and athletic performance. Two individuals standing 180 cm tall and weighing 85 kg can possess radically divergent physiological profiles: one may present with 32% adipose tissue in a pre-diabetic state, while the other carries a dense, drug-free 12% physique with near-limit muscularity. Discover how the Universal Lean Body Mass (LBM) Calculator & FFMI Studio partitions body weight into exact physiological compartments, predicts drug-free hypertrophy ceilings, and establishes lean-mass-indexed nutritional baselines.
1. Defining the Biological Spectrum: LBM vs. Fat-Free Mass (FFM)
In casual fitness discourse, the terms Lean Body Mass (LBM) and Fat-Free Mass (FFM) are frequently used interchangeably. However, clinical anthropometry draws a decisive anatomical distinction between the two:
- Fat-Free Mass (FFM): Strictly defined as total organismal mass devoid of all extractable lipids. FFM encompasses skeletal muscle, organic bone matrix, visceral organs, extracellular water, and blood volume, discounting 100% of adipose tissue and essential fatty acids.
- Lean Body Mass (LBM): Encompasses all of FFM while explicitly retaining essential non-storage cellular lipids. These functional lipids are embedded within cell membranes, visceral myelin sheaths, central nervous tissue, and bone marrow. Essential lipids account for roughly 2% to 3% of body mass in adult males and 5% to 7% in females to sustain reproductive and endocrine homeostasis.
When you run your biometrics through the LBM Calculator & Muscular Potential Architect, the computational matrix partitions your physique into active functional tissue versus surplus storage adipose tissue.
2. The Multi-Equation Formulation Matrix: Boer, James, and Hume
Direct gold-standard modalities such as Dual-Energy X-ray Absorptiometry (DEXA), underwater hydrostatic weighing, and 4-compartment magnetic resonance imaging (MRI) are costly and inaccessible for regular check-ins. To resolve this, clinical investigators developed validated mathematical population formulas that reliably predict lean tissue mass using stature (height) and gross scale weight:
1. Boer Formula (1984) Hospital Pharmacokinetic Benchmark
Developed by Dr. P. Boer and colleagues, this formulation is considered the gold standard in pharmacokinetics. Hospital clinicians utilize the Boer model to calculate safe dosages for hydrophilic medications (such as aminoglycosides, digoxin, and anesthetics) that disperse exclusively within lean vascular fluid:
Female: LBM (kg) = (0.252 × Weightkg) + (0.473 × Heightcm) – 48.3
2. James Formula (1976) Classical Forensic & Nutritional Model
W.P.T. James developed this quadratic formulation to counteract the linear skew observed in early height-weight tables. By penalizing disproportionate weight-to-height ratios, it remains a staple in nutritional epidemiology:
Female: LBM (kg) = 1.07 × Weightkg – 148 × (Weightkg / Heightcm)2
3. Hume Formula (1966) — Physiological Water Dilution Metric
Derived from isotopic antipyrine and deuterium water dilution studies, Dr. R. Hume’s model accurately correlates total body water (~73.2% of fat-free mass) with active vascular tissue:
Female: LBM (kg) = (0.29569 × Weightkg) + (0.41813 × Heightcm) – 43.2933
4. Direct Body Fat % Derivation (When DEXA or Caliper Data is Known)
If you have recently undergone a DEXA scan or accurate skinfold caliper measurement, the direct mathematical derivation provides the cleanest baseline:
LBMdirect (kg) = Total Weight (kg) – Fat Mass (kg)
With the RiazHub Lean Body Mass Tool, you can toggle between Boer, James, Hume, and Direct Derivation or select the Consensus Average to neutralize individual equation outliers.
3. Fat-Free Mass Index (FFMI) & Natural Muscular Ceilings
Body Mass Index (BMI = kg/m2) routinely misclassifies athletic individuals as “overweight” or “obese” because it fails to distinguish between muscle hypertrophy and visceral adipose accumulation. To correct this diagnostic blind spot, Dr. Harrison Kouri and colleagues at Harvard Medical School introduced the Fat-Free Mass Index (FFMI) in 1995:
Because taller lifters naturally accumulate greater absolute mass per unit of height without necessarily exhibiting superior muscularity, Kouri introduced a height-normalized adjustment standardized to a 1.80m baseline:
| Tier Classification | Male nFFMI Range | Female nFFMI Range | Clinical & Athletic Profile |
|---|---|---|---|
| Low / Sarcopenic | < 18.0 | < 15.0 | Sub-optimal muscle reserve; higher risk of metabolic dysfunction. |
| Average Fitness | 18.0 – 19.9 | 15.0 – 16.9 | Recreationally active; normal muscle mass. |
| Well-Developed Athlete | 20.0 – 21.9 | 17.0 – 18.9 | Several years of progressive resistance training and optimized nutrition. |
| Near Natural Muscular Limit | 22.0 – 24.9 | 19.0 – 21.9 | Elite natural drug-free physique; top 1% genetic development. |
| Genetic Outlier / Suspicious | 25.0+ | 22.0+ | Rare natural genetic freak or likelihood of exogenous androgen use. |
4. Casey Butt Anthropometric Bone Ceiling Model
How much muscle can you realistically build drug-free? Exercise scientist Casey Butt, Ph.D., analyzed decades of drug-free elite champions across historical eras prior to the invention of synthetic anabolic steroids. His findings established that human muscular potential is fundamentally constrained by skeletal bone structure, specifically the narrowest circumference of the wrist and ankle:
By measuring your wrist and ankle joints in the LBM Studio Muscular Ceiling Drawer, you receive an empirical projection of your maximum genetic muscular ceiling at 8%–10% body fat, revealing exactly how many kilograms of natural muscle tissue you have left to gain.
5. Sports Nutrition: Indexing Daily Protein & Caloric Baselines to LBM
A widespread mistake in sports nutrition is prescribing daily protein intake as a function of total scale weight (e.g., 2g per kg of total body weight). For an individual carrying 35% body fat, this inflates caloric and protein intake, creating unnecessary metabolic burden and digestive distress.
Muscle preservation and fractional synthetic rate (FSR) are biologically mediated by active lean tissue, not adipose storage fat. Utilizing lean-mass-indexed prescriptions ensures optimal nitrogen retention:
- Cutting Phase (Caloric Deficit): 2.4g – 2.8g of protein per kg of LBM (1.1g – 1.3g/lb LBM) to prevent muscular catabolism and sustain gluconeogenic demands.
- Maintenance / Recomposition Phase: 2.2g – 2.6g of protein per kg of LBM (1.0g – 1.2g/lb LBM) to fuel muscle remodeling and recovery.
- Bulking Phase (Caloric Surplus): 1.8g – 2.2g of protein per kg of LBM (0.8g – 1.0g/lb LBM) due to the strong protein-sparing action of surplus carbohydrate intake.
Basal Metabolic Energy Baselines: Katch-McArdle & Cunningham
Standard equations like Harris-Benedict or Mifflin-St Jeor rely on age, height, and gross weight. However, when Lean Body Mass is known, advanced sports scientists rely on the Katch-McArdle Formula:
For competitive collegiate and Olympic strength athletes, the Cunningham Formula ($BMR = 500 + 22 \times LBM_{kg}$) accounts for enhanced mitochondrial density and basal muscle turnover. Both metrics are computed instantaneously within the Online LBM Calculator.
6. How to Use the Tool in 4 Simple Steps
- Select Your Unit System: Toggle between Metric (cm, kg) and Imperial (ft/in, lbs).
- Input Biometrics: Enter your biological sex, age, standing height, and scale weight. If you possess recent caliper or DEXA data, input your body fat percentage to activate direct derivation mode.
- Calibrate Bone Frame (Optional): Expand the Natural Muscular Ceiling Calibration drawer to input wrist and ankle circumferences for personalized Casey Butt projections.
- Analyze Diagnostics & Export: Switch across the visual spectrum ring, FFMI gauge, comparative matrix, and protein prescription tabs. Generate a downloadable 1200×630 high-resolution dossier card or copy an itemized summary directly to your clipboard.
Conclusion: Transition from Guesswork to Precision Partitioning
Ditching arbitrary scale weight in favor of precise Lean Body Mass partitioning is essential for anyone serious about athletic performance, progressive overload, and longevity. Test your biometrics today using the 100% private, client-side Universal Lean Body Mass (LBM) Calculator & FFMI Studio on RiazHub.
Universal Lean Body Mass (LBM) Calculator & FFMI Studio
Precision clinical body composition partitioning engine. Compute exact lean tissue weight, evaluate drug-free muscular potential with Normalized FFMI (nFFMI), benchmark against Casey Butt bone ceiling models, and bridge directly to lean-mass-tailored protein targets.
The Casey Butt Anthropometric Bone Model predicts natural drug-free muscular limits based on skeleton wrist and ankle circumferences.
Clinical LBM incorporates essential cellular lipids (~2.5% in males, ~5% in females) required for central nervous myelination and steroidogenesis. FFM strictly discounts these lipids.
Total body water represents ~73.2% of fat-free mass in euhydrated humans. Acute weight swings of 1–3 kg reflect glycogen-bound water rather than actual muscle hypertrophy.
Side-by-side variance analysis across peer-reviewed anthropometric models.
| Equation Model | Lean Mass (kg / lbs) | Fat Mass (kg) | Variance vs Active | Primary Clinical Indication |
|---|
Protein requirements tailored directly to active fat-free mass to optimize nitrogen retention and nitrogen balance.
🔬 Clinical Anthropometry & Body Composition Compendium
🧬 Lean Body Mass (LBM) vs. Fat-Free Mass (FFM)
While frequently used synonymously in sports fitness culture, clinical literature draws a sharp anatomical distinction. Fat-Free Mass (FFM) represents total body weight entirely devoid of lipids. Conversely, Lean Body Mass (LBM) accounts for essential non-adipose structural lipids embedded within organ cellular membranes, visceral bone marrow, and the central nervous system (~2%–3% in men, ~5%–7% in women).
📐 Deciphering Normalized FFMI & Kouri Limits
In 1995, Harvard researcher Harrison Kouri and colleagues evaluated 157 male athletes (including 74 non-users and 83 androgen users). The study demonstrated that drug-free athletes peaked around an empirical ceiling of 25.0 nFFMI. Normalized FFMI ($n\text{FFMI} = \text{FFMI} + 6.1 \times (1.80 - \text{Height}_m)$) removes the positive height bias that penalizes shorter lifters.
💊 Pharmacokinetic Utility of Boer & James Formulas
Clinical pharmacists and anesthesiologists avoid scaling hydrophilic drug dosages to total scale weight in obese individuals because adipose tissue contains minimal extracellular water. High-potency agents like digoxin, rocuronium, and aminoglycosides distribute almost exclusively into lean vascularized compartments; calculating Boer or James LBM prevents acute drug toxicity.
🛡️ Zero Server Leakage & Client-Side Privacy
All mathematical matrix partitioning, Casey Butt bone structure models, macronutrient derivatives, HTML5 canvas rendering, and clipboard actions execute 100% inside your local web browser. No personal biometrics, weight values, or identifiers are logged or sent across external networks.