
The Science of Fuel Metrology: Demystifying L/100 km, the MPG Illusion, EV MPGe, and Journey Economics
Whether you are an automotive engineer benchmarking thermal efficiency, a fleet manager auditing logistics fuel budgets across continents, or an everyday motorist wondering why your car’s fuel efficiency looks drastically different on British, American, and European specification sheets, automotive metrology is full of counterintuitive mathematical traps.
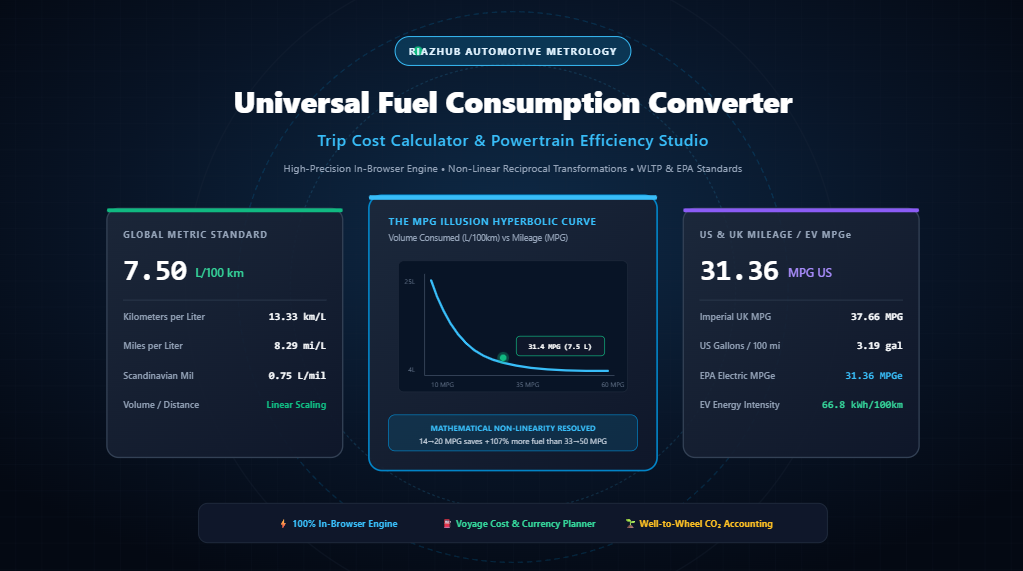
At the center of global automotive discussions lies an ongoing debate: why does most of the civilized world measure fuel consumption as volume-per-distance (L/100 km), while the United States and the United Kingdom persist with distance-per-volume (MPG)? More importantly, how does this reciprocal relationship create the infamous “MPG Illusion” that tricks consumers into misjudging fuel savings?
To solve these exact challenges, explore the interactive Universal Fuel Consumption Converter, Trip Cost Calculator & Powertrain Efficiency Studio on RiazHub. This client-side metrology engine provides instant, floating-precision conversions between all metric, imperial, and EV powertrain metrics without server round-trips.
1. The Fundamental Mathematical Divide: Linear vs. Reciprocal
Every measurement system in modern automotive engineering falls into one of two fundamental mathematical families:
- Volume-per-Distance (Linear with Fuel Burned): Liters per 100 Kilometers (L/100 km), US Gallons per 100 Miles (gal/100 mi), and Scandinavian Mil (L/mil).
- Distance-per-Volume (Non-Linear Reciprocal): Miles per US Gallon (MPG US), Miles per Imperial Gallon (MPG UK), Kilometers per Liter (km/L), and Miles per Liter (mi/L).
Why does this distinction matter so profoundly? Because fuel consumed scales linearly with distance, not with MPG. If you drive twice as far, you burn twice as much fuel. If your car consumes 8.0 L/100 km and you drive 500 km, you will burn exactly 40 liters of fuel. The financial cost and the mass of carbon dioxide emitted are directly proportional to the L/100 km rating.
Conversely, when fuel efficiency is expressed as Miles per Gallon (MPG), the math turns into an inverse hyperbola:
The mathematical relationship between Metric Standard Consumption and US EPA Mileage is strictly reciprocal:
L/100 km = 235.214583 / MPG (US) ↔ MPG (US) = 235.214583 / (L/100 km)
Because the denominator contains the variable, equal linear increases in MPG do not produce equal fuel savings.
2. Deconstructing the “MPG Illusion”: The Psychological Trap
First documented in behavioral economics and automotive policy by Duke University researchers Richard Larrick and Jack Soll, the MPG Illusion refers to the cognitive cognitive bias where drivers perceive changes in MPG as linear improvements in fuel efficiency.
Consider the following classic thought experiment:
- Driver A replaces an inefficient full-size pickup truck getting 14 MPG with a modern crossover getting 20 MPG (+6 MPG jump).
- Driver B replaces an already efficient compact sedan getting 33 MPG with an ultra-efficient hybrid getting 50 MPG (+17 MPG jump).
To the untrained consumer, Driver B’s upgrade (+17 MPG) looks nearly three times more impressive than Driver A’s modest +6 MPG increase. Yet, when evaluated over an annual driving distance of 10,000 miles, the actual fuel saved tells an astonishingly different story:
| Driver Scenario | Starting Rating | Upgraded Rating | MPG Delta | Fuel Used (10,000 mi) | Net Fuel Saved |
|---|---|---|---|---|---|
| Driver A (Truck Upgrade) | 14.0 MPG (16.8 L/100km) | 20.0 MPG (11.8 L/100km) | +6.0 MPG | 714 gal → 500 gal | Saved: 214 Gallons (810 L) |
| Driver B (Sedan Upgrade) | 33.0 MPG (7.1 L/100km) | 50.0 MPG (4.7 L/100km) | +17.0 MPG | 303 gal → 200 gal | Saved: 103 Gallons (390 L) |
Driver A saved more than double the fuel of Driver B, despite achieving a numerical MPG increase that looked less than half as large! Upgrading an inefficient vehicle yields massive volumetric dividends because the curve is steep at low MPG ratings and plateaus at high MPG ratings.
You can visualize this dynamic live on the interactive 2D Hyperbolic Curve Visualizer built into the online Fuel Consumption Converter tool.
3. The US Gallon vs. Imperial Gallon Mystery: The ~20% British Gap
If you browse British automotive reviews (such as Top Gear or Car Magazine) and compare them with American publications (Car and Driver, MotorTrend), you will frequently notice that European cars claim significantly higher MPG numbers in the United Kingdom than identical models sold in the United States.
This is not because British fuel is superior or British roads have less rolling resistance—it is entirely due to the legal definition of the gallon:
- United States Liquid Gallon: Officially standardized as 231 cubic inches, which equals exactly 3.785411784 Liters.
- British Imperial Gallon: Originally defined in 1824 as the volume of 10 pounds of distilled water at 62°F, standardized as exactly 4.54609 Liters.
Because an Imperial gallon contains 20.095% more volume than a US gallon, an automobile traveling on one Imperial gallon will travel ~20.1% further. For instance, a vehicle rated at 40 MPG (US) delivers 48.04 MPG (UK) while consuming identical amounts of fuel: 5.88 L/100 km.
When auditing international vehicle import documentation or cross-border logistics manifests, converting through the RiazHub Fuel Metrology Studio prevents costly volumetric miscalculations.
4. How the EPA Standardizes Electric Vehicles: Understanding MPGe
With the global acceleration of electric mobility, metrologists needed a standardized baseline to compare electric drivetrains directly against internal combustion engines. In 2010, the US Environmental Protection Agency established Miles per Gallon Gasoline Equivalent (MPGe).
The EPA determined that the average chemical energy content of one standard US gallon of unleaded gasoline is approximately 115,000 British Thermal Units (BTU) at standard temperature and pressure. Converting this thermal energy into electrical power yields:
1 US Gallon Gasoline Equivalent ≡ 33.705 Kilowatt-Hours (kWh)
If an electric vehicle consumes 33.705 kWh of electricity to travel 100 miles, its rating is precisely 100 MPGe. In metric countries, EV efficiency is expressed as kWh/100 km. An aerodynamic electric sedan consuming 16.0 kWh/100 km achieves roughly 130 MPGe, revealing how electric drivetrains convert over 85% of grid electrical energy into kinetic movement compared to the ~25% to 35% thermal efficiency of gasoline engines.
5. Route Economics & Well-to-Wheel Carbon Accounting
Converting efficiency numbers is only half the journey. Fleets and private drivers need to understand financial outlay and environmental impact.
Direct Combustion Chemistry
Many drivers wonder: “How can one liter of gasoline, which weighs only ~0.74 kilograms, produce 2.31 kilograms of carbon dioxide?”
The answer lies in atmospheric chemistry. Gasoline is comprised of hydrocarbons (CnH2n+2). During engine combustion, each carbon atom binds with two oxygen atoms drawn from the surrounding air:
C (atomic weight 12) + O2 (atomic weight 32) → CO2 (molecular weight 44)
Because oxygen contributes 72.7% of the mass of the resulting CO2 molecule, the exhaust gas is almost three times heavier than the carbon payload of the liquid fuel itself:
- Gasoline / Petrol: Emits ~2.31 kg CO2 per liter burned.
- Diesel: Longer hydrocarbon chains; emits ~2.68 kg CO2 per liter burned.
- LPG (Liquefied Petroleum Gas): Emits ~1.51 kg CO2 per liter burned.
- Grid Electricity: Average global grid intensity generates ~0.42 kg CO2 per kWh.
The RiazHub Trip Cost & Powertrain Planner incorporates these exact stoichiometry emission factors alongside multi-currency expenditure projections (in SAR, PKR, USD, EUR, and GBP).
6. How to Use the Universal Fuel Metrology Studio
The Universal Fuel Consumption Converter & Trip Cost Studio was engineered for speed, mathematical precision, and zero data leakage:
- Select Your Ingestion Mode: Choose the Instant Multi-Unit Matrix for immediate synchronized conversions, or toggle to the Route Fuel & Cost Planner for road trip budgeting.
- Input Your Vehicle’s Rating: Type any numerical value (e.g., 6.5) and choose your unit (L/100 km, MPG US, MPG UK, km/L, or kWh/100 km). All other units recalculate instantaneously.
- Inspect Floating Precision: Choose between 2, 4, 6, or 8 decimal places for laboratory or fleet accounting precision.
- Load Benchmarks with 1 Click: Test archetypes ranging from a 3.8 L/100 km compact hybrid to a 28.0 L/100 km commercial truck.
- Generate High-DPI Specification Dossiers: Head to the Dossier Card Studio tab to create and download high-resolution 1200×630 technical cards in Obsidian Dark, Light Azure, Eco Emerald, or Petroleum Amber themes.
- Export Your Logistics Data: Use the 1-click toolbar to copy a formatted text memo, download a CSV matrix, or print a clean PDF voyage brief.
7. Frequently Asked Questions (FAQ)
Universal Fuel Consumption Converter & Trip Cost Studio
High-precision automotive metrology engine. Convert L/100 km, MPG (US & UK), km/L, and electric MPGe, project journey fuel costs and carbon footprints, and understand the non-linear MPG illusion.