
Mastering Image Compression: Bits-Per-Pixel (bpp), Next-Gen Codecs, and Perceptual Fidelity Analysis
Discover why measuring raw file size in kilobytes is misleading, how mathematical bits-per-pixel (bpp) density reveals true asset bloat, and how modern WebP and AVIF re-compression saves bandwidth without sacrificing human-perceptible quality.
Why Heavy Images Are the #1 Killer of Core Web Vitals
According to the HTTP Archive, images constitute over 50% of the total byte weight transferred during a typical webpage visit. When visitors load an unoptimized webpage on a cellular network, large media assets delay the browser’s main thread, consume critical data bandwidth, and directly degrade Google’s Core Web Vitals specifically Largest Contentful Paint (LCP).
Google mandates an LCP render time of under 2.5 seconds for a “Good” rating. If your featured hero banner is a 2.4 MB raw JPEG exported directly from Adobe Photoshop or a digital camera, mobile devices will spend several seconds simply downloading and decompressing the pixel matrix.
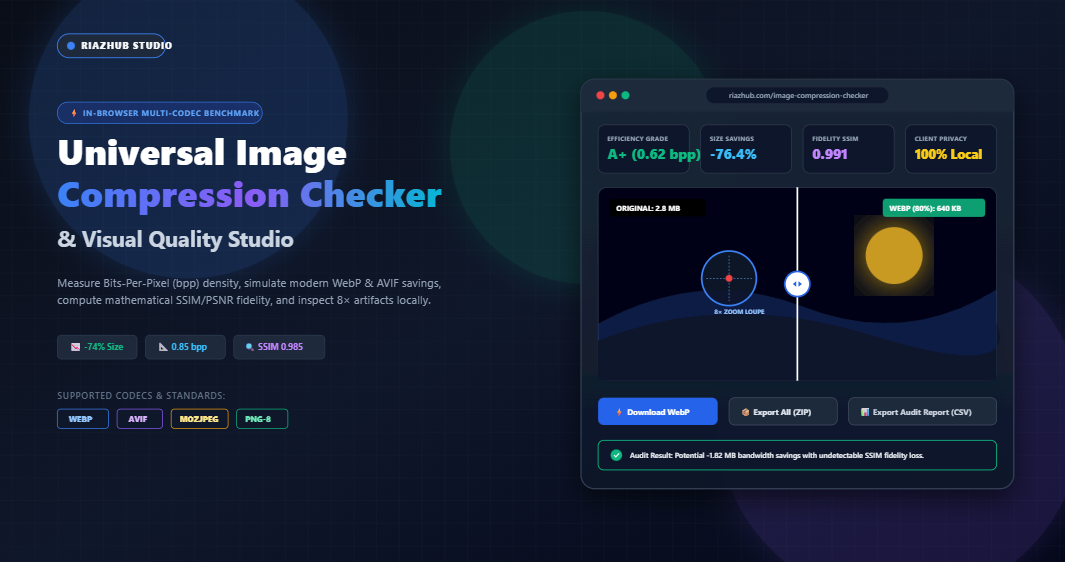
To solve this without guessing, web engineers rely on client-side diagnostic utilities like the Image Compression Checker & Visual Quality Studio to evaluate exact payload efficiency before committing media to a production content delivery network (CDN).
⚡ Audit Your Images in Real Time
Want to see how much weight your website’s hero banners and thumbnails are wasting? Run an instant, private, in-browser analysis with zero server uploads.
The Mathematical Truth: Why Bits-Per-Pixel (bpp) Is the Gold Standard Metric
Most web designers evaluate images by asking: “How many kilobytes is this file?” While intuitive, raw file size is a fundamentally flawed metric for optimization.
Consider this paradox:
- A 150 KB image measuring 300 × 200 pixels represents an enormous 20.0 bits-per-pixel. It is wildly bloated, heavily uncompressed, and wasteful.
- A 250 KB image measuring 1920 × 1080 pixels represents just 0.96 bits-per-pixel. It is remarkably efficient, lightweight, and perfectly tailored for responsive desktop displays.
This is why senior performance engineers measure Bits-Per-Pixel (bpp):
bpp = (File Size in Bytes × 8) ÷ (Width in Pixels × Height in Pixels)By computing how many binary bits are dedicated to describing each physical screen pixel, you gain a normalized benchmark that remains accurate regardless of whether you are inspecting an avatar icon or an ultra-wide full-screen banner.
| bpp Range | Classification | Typical Asset State | Recommended Action |
|---|---|---|---|
| < 0.50 bpp | Ultra Efficient | Modern WebP or AVIF at 70–80% quality, flat vector gradients. | Ready for production CDN delivery. |
| 0.50 – 1.50 bpp | Well Optimized | Standard high-detail photography in optimized WebP or tuned JPEG. | Excellent balance of detail and speed for WordPress blogs. |
| 1.50 – 3.00 bpp | Moderate Bloat | Legacy 85%+ quality baseline JPEG or unquantized PNGs. | Simulate WebP conversion to reclaim 40–60% file size. |
| > 3.00 bpp | Heavily Bloated | Raw 24-bit PNGs, uncompressed camera exports, or bloated metadata. | Immediate optimization required; severely harms mobile LCP. |
You can verify your current website media against these thresholds using the free Image Compression Checker on RiazHub.
Multi-Codec Architecture: JPEG vs. WebP vs. AVIF vs. PNG
Modern web development is no longer restricted to legacy 1990s formats. Let’s compare how the underlying mathematical encoding algorithms operate:
1. MozJPEG & Tuned JPEG (Discrete Cosine Transform)
JPEG divides images into 8×8 pixel blocks and applies the Discrete Cosine Transform (DCT) to discard high-frequency spatial details that the human eye struggles to perceive. While MozJPEG introduces optimized Huffman coding tables and trellis quantization to squeeze legacy files by an additional 10–15%, it still suffers from characteristic “blockiness” and color banding at lower bitrates.
2. Google WebP (Predictive Block Coding)
WebP relies on the VP8 video keyframe codec architecture. Instead of treating blocks independently, it uses intra-frame predictive coding—predicting the colors of adjacent sub-blocks based on surrounding pixel vectors and only encoding the difference (residual). This allows WebP to deliver 25% to 35% smaller file sizes than JPEG at identical perceptual quality, with universal 98.4%+ global browser support.
3. AVIF (AOMedia Video 1 Intra-Frame)
Derived from the open-source AV1 video stream codec, AVIF employs advanced directional prediction filters, variable block partitions from 4×4 up to 128×128 pixels, and sophisticated chroma subsampling. In heavy photographic benchmarks, AVIF frequently yields up to 50% byte savings over traditional JPEG, though encoding times are more computationally intensive.
4. Palette Quantized PNG (PNG-8 vs. PNG-24)
Standard PNG-24 uses lossless DEFLATE compression with 8-bit alpha channels. However, for UI mockups, logos, charts, and application screenshots, converting 24-bit TrueColor into an indexed 256-color palette (PNG-8) slashes file size by up to 70% while preserving razor-sharp vector line art without JPEG ringing noise.
Using the RiazHub Image Compression Checker, you can run offscreen simulations of these codecs simultaneously right inside your browser to see which format produces the highest byte reduction for your specific artwork.
Quantifying Visual Fidelity: How SSIM and PSNR Prove Quality Retention
A common hesitation among digital creators is: “If I reduce my file size by 75%, won’t my images look degraded or blurry?”
Rather than relying on subjective human guesswork, digital signal processing provides mathematical metrics to measure distortion:
Peak Signal-to-Noise Ratio (PSNR)
PSNR evaluates the Mean Squared Error (MSE) across the red, green, and blue color channels between the uncompressed source buffer ($I_1$) and the re-encoded compressed buffer ($I_2$):
MSE = (1 / 3N) × Σ [ (R₁ - R₂)² + (G₁ - G₂)² + (B₁ - B₂)² ]
PSNR = 10 × log₁₀( 255² ÷ MSE ) dB
In lossy web compression, a PSNR score above 38 dB is considered high quality. Scores approaching 42 to 48 dB signify that distortion is virtually imperceptible under normal viewing conditions.
Structural Similarity Index (SSIM)
While PSNR calculates raw absolute pixel variance, the Structural Similarity Index (SSIM) models the human visual system (HVS). It evaluates image fidelity across three distinct dimensions:
- Luminance correlation: Preservation of scene brightness.
- Contrast correlation: Preservation of dynamic range.
- Structural correlation: Preservation of object edges and textures.
SSIM outputs a decimal rating between 0.00 and 1.00:
- 1.000: Mathematically identical pixel buffer.
- 0.950 – 0.990: Perceptually transparent compression. File weight is cut by 60–80%, but human observers cannot discern any difference without side-by-side microscopic zooming.
- < 0.880: Noticeable compression artifacts, edge ringing, and texture smudging become visible.
You can verify SSIM and PSNR scores for any image instantly via the Image Compression Checker & Visual Quality Studio.
How to Audit Image Compression with RiazHub’s In-Browser Studio
The Image Compression Checker provides a comprehensive client-side optimization suite:
- Load or Paste Images: Drag and drop single or multiple JPG, PNG, WebP, AVIF, or BMP files into the workspace, click “Select Image(s)”, or simply press
Ctrl + Vto paste from your operating system clipboard. You can also click “Sample Photo” to load a built-in high-resolution gradient test pattern. - Select an Optimization Profile: Choose from pre-configured presets such as WordPress Blog (WebP 80%), E-Commerce Catalog (< 200KB), or Retina / High-DPI (2x Density), or adjust the WebP and MozJPEG quality sliders manually.
- Inspect the Multi-Format Benchmark Matrix: View side-by-side cards comparing the Original source against modern WebP, tuned JPEG, and lossless PNG. Check file sizes, exact bandwidth savings percentages, bits-per-pixel ratings, and individual download buttons.
- Use the Split-Screen Comparison Slider: Drag the interactive center divider to perform real-time before/after pixel analysis between the original file and the simulated compressed stream.
- Examine Micro-Details with the 8× Artifact Loupe: Hover over the canvas to inspect 8× pixel magnification. The built-in reticle highlights 8×8 DCT block boundaries, edge ringing, and chroma subsampling noise.
- Export Reports & Bundles: Download the single best compressed WebP file with one click, export all generated variants packaged inside a zero-dependency in-memory ZIP archive, or copy complete JSON/CSV audit reports for team documentation.
🔒 Complete Privacy Guarantee
Unlike traditional online compressors that upload your graphics to remote cloud servers, the entire audit pipeline runs 100% locally in your web browser via HTML5 Canvas and JavaScript. Your private photos, product drafts, and sensitive documents never leave your computer.
5 Golden Rules for Website Image Optimization
- Never Upload Unscaled Camera Resolutions: A 6000 × 4000 pixel camera capture requires massive CPU memory to decode in the browser. Always downscale your imagery to match the maximum display container (typically 1200px or 1920px wide) before auditing compression.
- Aim for the 0.50 – 1.20 bpp Sweet Spot: If your compressed image falls in this range, it will load almost instantly on 4G and 5G connections while maintaining crisp detail on modern Retina screens.
- Standardize on WebP for WordPress: WebP is natively supported in WordPress 5.8+ and across all modern browsers. It provides transparent background support like PNG while matching or beating lossy JPEG compression efficiency.
- Reserve PNG for Vector-Like Flat Graphics: If an image consists of flat colors, text, or vector icons, use 8-bit PNG palette quantization. If it is a photograph with natural gradients, use WebP or AVIF.
- Audit Media Pre-Upload: Avoid slow page load surprises after publishing blog posts or product listings. Take 15 seconds to run your images through the Image Compression Checker & Visual Quality Studio before adding them to your WordPress Media Library.
Frequently Asked Questions (FAQ)
What is the difference between lossy and lossless image compression?
Lossless compression (e.g., standard PNG or WebP Lossless) removes redundant data patterns and metadata without altering a single pixel value. When decoded, the image is mathematically identical to the original. Lossy compression (e.g., JPEG, WebP, AVIF) selectively discards high-frequency visual details that the human eye cannot easily discern, resulting in 60% to 85% smaller file sizes with virtually identical perceptual fidelity.
Why does a 100 KB image still cause slow Core Web Vitals (LCP)?
If that 100 KB image is a 3000px wide image compressed with extreme blur, the browser’s decoding engine must still allocate memory buffers for all 3000 pixels. Conversely, if a hero image has slow server response times (TTFB) or lacks modern responsive srcset attributes, it delays paint timing. Ensuring your asset is correctly dimensioned and below 1.5 bpp solves the network payload bottleneck.
Is it safe to test proprietary product photos or client documents?
Yes. The RiazHub Image Compression Checker executes 100% client-side inside your browser sandbox. No file buffers, pixel streams, or metadata are ever transmitted to an external server or stored in the cloud.
What is an ideal target quality setting for WebP?
For standard web publishing and WordPress blogs, a quality setting between 75% and 82% delivers the optimal balance of imperceptible visual loss (SSIM > 0.96) and dramatic 60–75% file weight reductions.
Universal Image Compression Checker & Visual Quality Studio
Audit bits-per-pixel efficiency, quantify lossy vs. lossless bloat, benchmark modern WebP / AVIF / MozJPEG streams, estimate SSIM / PSNR fidelity, and inspect compression artifacts in real time.
| File Name | Resolution | Original | Optimized | Savings | bpp | Grade |
|---|
bpp = (File Size in Bytes × 8) ÷ (Width × Height)
A rating below 1.5 bpp indicates modern web optimization. Values exceeding 3.0 bpp typically mean uncompressed raw PNGs or low-efficiency legacy JPEGs that waste visitor cellular data.
Structural Similarity Index (SSIM) assesses luminance, contrast, and structural texture correlation. A score of 0.95 or higher proves that visual quality is virtually indistinguishable to the human eye, despite shedding 60-80% of file weight.