
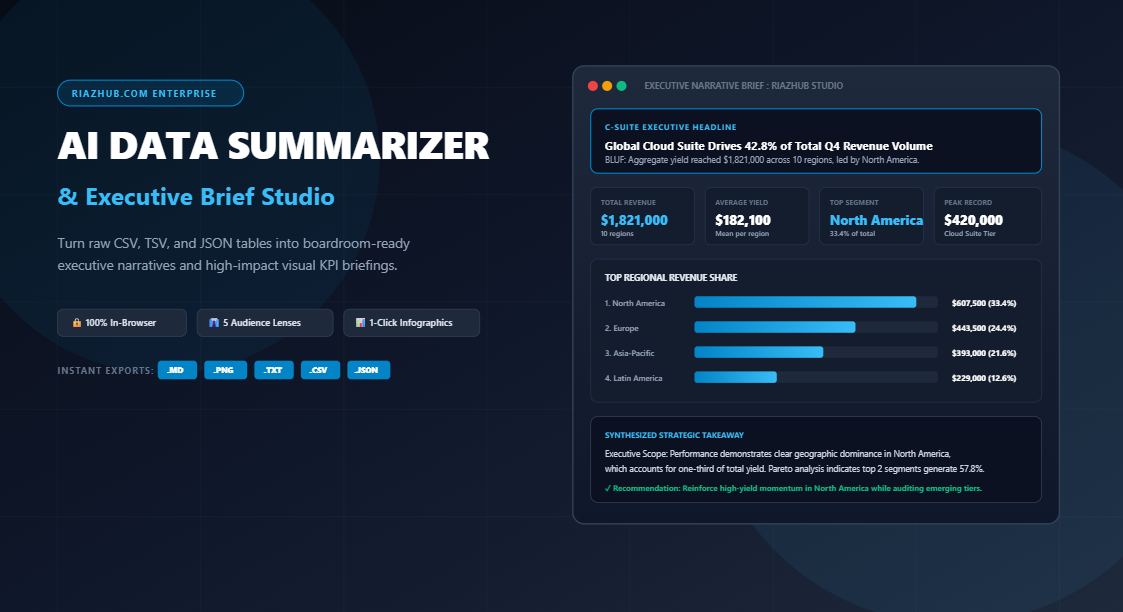
Transforming Raw Spreadsheets into Boardroom Narratives: The Ultimate Guide to In-Browser Executive Data Summarization
Every business day, countless hours are lost inside spreadsheet cells. Analysts export 500-row CSV reports from Stripe, Google Analytics, Salesforce, or internal SQL databases, paste them into spreadsheet grids, and spend the afternoon manually drafting bullet points for Monday morning executive briefings. Yet, despite having more data than ever before, modern organizations frequently suffer from a familiar paradox: they are rich in raw figures, but starved for actionable narrative clarity.
When leadership opens a report, they are rarely searching for cell C14 or row 82. They need to answer three foundational questions in under thirty seconds: What happened? Why does it matter? What specific decision should we make right now?
To eliminate manual reporting bottlenecks without compromising confidential financial figures, teams are turning to the AI Data Summarizer, Executive Narrative Synthesizer and KPI Brief Studio on RiazHub. This modern client-side studio transforms messy tabular rows into articulate, boardroom-ready paragraphs, automated Pareto concentration alerts, statistical benchmark callouts, and downloadable high-resolution infographic cards: 100% locally in your web browser with zero server uploads.
The Structural Disconnect: Rows vs. Decisions
Spreadsheets are designed for storage, computation, and tabular querying. They are fundamentally unsuited for cognitive storytelling. Presenting an executive with a 20-column grid forces them to act as a human compiler, mentally calculating averages, comparing peaks against medians, and hunting for anomalies.
Effective business intelligence requires translation: transforming structured tables into structured prose. This translation rests upon three core communication principles:
- The Bottom Line Up Front (BLUF) Principle: Originated in military intelligence and perfected in Fortune 500 boardrooms, the BLUF framework demands that your primary quantitative conclusion lead the report. The first two sentences must communicate total magnitude, primary segment leadership, and core variance.
- Contextual Benchmarking Over Raw Numbers: Stating that a European enterprise tier produced $310,000 is merely descriptive. Stating that European sales accounted for 33.4% of total revenue and exceeded the division average by 18.2% delivers immediate decision-making context.
- Pareto 80-20 Concentration Alerts: Identifying how many categories generate 80% of aggregate volume reveals operational vulnerability, client concentration risk, and capital allocation priorities.
By using the RiazHub AI Data Summarizer, these mathematical and narrative transformations happen instantaneously without requiring Python scripts, complex macros, or external AI cloud APIs.
Experience Deterministic Tabular-to-Prose AI
Convert your CSV, TSV, or JSON tables into polished executive memos, KPI spotlight cards, and downloadable PNG infographics in seconds.
How Multi-Audience Calibration Changes the Game
A single dataset holds completely different meanings depending on who is reading it. An identical sales ledger demands one style of communication for the Chief Executive Officer, another for the Head of Finance, and yet another for the Growth Marketing Director.
The Executive Narrative Synthesizer on RiazHub solves this through dynamic audience calibration lenses:
👔 C-Suite Executive Lens
Focuses on high-level bottom-line contribution, macro volume leaders, portfolio concentration, and 3 high-impact strategic next steps.
💰 Financial & Revenue Audit
Emphasizes fiscal totals, arithmetic mean versus median skew, dispersion ranges (peak to minimum), and revenue concentration risk.
📈 Marketing & Growth Performance
Highlights acquisition winners, conversion rate distribution, channel efficiency benchmarks, and campaign scaling opportunities.
⚙️ Operations & Supply Chain
Isolates capacity utilization, processing throughput, unit workload concentration, and systemic operational bottleneck alerts.
In addition, the plain-English general stakeholder setting strips away technical jargon entirely, crafting natural, accessible sentences suitable for cross-functional company updates or client-facing milestone summaries.
Why 100% In-Browser Client-Side Processing Is Critical
Over the past two years, numerous cloud-based AI tools have emerged promising automated data analysis. However, uploading proprietary operational figures, quarterly revenue spreadsheets, patient logs, or customer lists to third-party cloud servers creates significant compliance hazards:
- Confidential Financial Exposure: Sending unreleased quarterly numbers or sensitive profit margins across public cloud endpoints risks violating enterprise privacy policies and NDA covenants.
- Data Retention and AI Training Risks: Cloud services frequently log prompt inputs or retain raw attachments for model refinement unless enterprise opt-out agreements are in place.
- API Downtime and Latency: Remote API calls introduce latency, token limits, truncation errors, and unexpected service interruptions.
The Universal AI Data Summarizer Studio eliminates these concerns through strict client-side execution. By leveraging modern browser standards: including the HTML5 FileReader API, Canvas 2D engine, and client-side Blob generation: 100% of the ingestion, numeric parsing, variance calculations, narrative synthesis, and infographic rendering occur directly on your local device. No raw rows, confidential numbers, or customer records are ever uploaded to any remote server.
Comprehensive Feature Comparison Matrix
| Capability | Manual Spreadsheet Workflow | Generic Cloud AI Chatbots | RiazHub AI Data Summarizer |
|---|---|---|---|
| Confidential Data Privacy | High (Local File) | Low (Server Upload) | 100% In-Browser (Zero Leak Risk) |
| Tabular-to-Prose Speed | 30 to 60 Minutes | 2 to 5 Minutes | Instantaneous (< 1 Second) |
| Deterministic Accuracy | Prone to Human Math Errors | Prone to LLM Hallucinations | 100% Mathematical Precision |
| Audience Lenses | Requires Manual Rewriting | Requires Extensive Prompting | 1-Click Multi-Audience Matrix |
| Visual Infographic Export | Requires Manual Design Tool | Text-Only Output | 1200×675 Canvas PNG Card |
| Standardized File Exports | Manual Copy-Paste | Manual Formatting | Branded .MD, .TXT, .PNG, .CSV, .JSON |
Step-by-Step Tutorial: Ingesting Data to Generating Branded Briefs
Generating your first executive memo with the RiazHub AI Data Summarizer Studio requires only three straightforward steps:
Step 1: Ingest Your Structured Dataset
You can drag and drop any local .csv, .tsv, or .json file into the dotted dropzone, or paste raw copied spreadsheet cells directly into the table console. If you wish to test the engine immediately, click any of the instant business scenarios (Quarterly Sales, Marketing Traffic, Support SLA, or Monthly Budget) located directly below the header.
Step 2: Calibrate Audience Lens and Depth Scope
Assign an optional context header (such as “Q4 2026 Enterprise SaaS Expansion”), select your target audience lens (e.g., C-Suite, Financial, or Operations), and choose your preferred summary depth:
- Concise TL;DR: Generates a punchy one-sentence BLUF and 3 core takeaway bullets for fast Slack or email updates.
- Standard Executive Brief: Formulates a structured 3-paragraph executive narrative, 4 KPI highlight boxes, and tactical recommendations.
- Detailed Analytical Narrative: Delivers a deep-dive multi-section breakdown exploring statistical distribution, category concentration, and median skew.
Step 3: Inline Edit and Export in Multiple Branded Formats
Review the generated report inside the previewer. Because the studio supports inline content editing, you can click directly on the generated headline, narrative paragraphs, or recommendation bullets to fine-tune the wording before downloading. When you are ready, choose your target format from the action toolbar:
- Download Markdown (.md): Formatted with frontmatter, KPI tables, and leaderboard rows, ready for GitHub, Notion, or internal wikis.
- Download Plain Text (.txt): Formatted with clean ASCII structural banners for executive emails or terminal memos.
- Download Summary Infographic (.png): Renders a high-resolution 1200×675 visual card complete with sparklines, bar graphs, and KPI tiles.
- Export KPI Digest (.csv): Generates a structured metric digest file containing mathematical benchmarks and category shares.
- Export JSON (.json): Provides complete serialized telemetry and narrative metadata for pipeline archiving.
Ready to Automate Your Executive Reporting?
Eliminate hours of repetitive summary writing. Synthesize boardroom-ready narratives and high-DPI KPI infographics completely inside your browser right now.
Frequently Asked Questions (FAQ)
Does this tool require an OpenAI or external API key?
No. The AI Data Summarizer Studio uses a deterministic statistical-to-narrative synthesis engine written in pure vanilla JavaScript. It requires zero API keys, zero cloud subscriptions, and zero external tokens.
Is my company data sent to RiazHub servers?
Never. The tool operates 100% client-side inside your browser memory. When you upload a CSV file or paste raw rows, they are processed locally through the browser FileReader API. Closing the tab immediately purges active data from memory.
Can I edit the generated text before downloading?
Yes. All headlines, BLUF callouts, narrative paragraphs, and recommendation bullet points feature inline editing. Any modifications you make are automatically synchronized across all downloadable Markdown, Plain Text, PNG Infographic, and JSON files.
What types of tabular files can I upload?
The ingestion pipeline supports comma-separated values (CSV), tab-separated values (TSV), semicolon-delimited tables, JSON arrays of objects, and raw tab-delimited text copied directly from Microsoft Excel or Google Sheets.
Conclusion: The Future of High-Velocity Data Storytelling
The value of data is not measured in the quantity of rows collected, but in the speed and clarity with which those rows drive decisions. By bridging the gap between raw spreadsheet calculations and executive-level storytelling, the AI Data Summarizer, Executive Narrative Synthesizer and KPI Brief Studio empowers analysts, founders, and department leaders to deliver boardroom-grade insights in seconds.
Visit RiazHub.com to explore the Universal AI Data Summarizer Studio and elevate your executive reporting workflow today.
Universal AI Data Summarizer, Executive Narrative Synthesizer and KPI Brief Studio
Transform raw spreadsheets, CSV exports, and complex tables into clear, boardroom-ready executive summaries in seconds. Automatically uncover top performers, averages, outliers, and growth insights, and export branded reports 100% locally in your browser.
📥 1. Ingestion & Narrative Deck
CSV / JSONPlease paste your tabular data or load a sample dataset to generate automated natural-language executive insights.
- Load or paste your operational data to receive contextual recommendations.
🏆 Top Performer Leaderboard
Share of Total| # | Attribute | Value |
|---|---|---|
| Awaiting tabular data input... | ||