
Universal AI CSV Analyzer, Statistical Profiler and Visual Data Intelligence Studio: Complete Guide
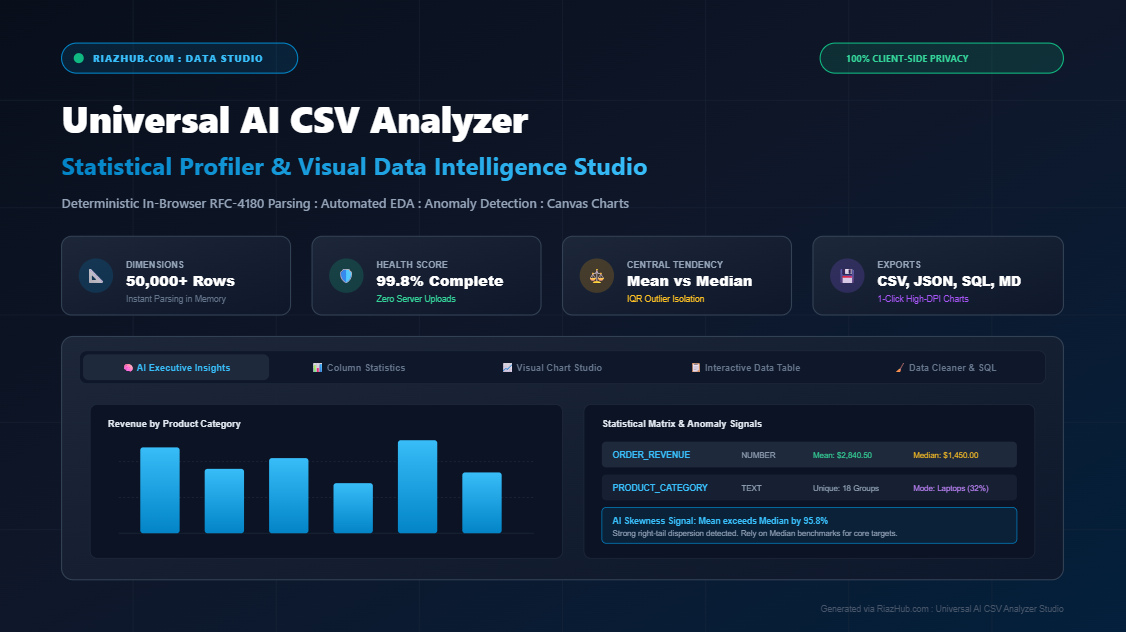
To solve these critical bottlenecks, RiazHub developed the Universal AI CSV Analyzer, Statistical Profiler and Visual Data Intelligence Studio. This browser-based suite executes complete exploratory data analysis (EDA), automated statistical profiling, anomaly detection, visual charting, and data sanitation directly inside your local browser memory with zero server uploads.
“True data intelligence should never demand compromising privacy. By processing entire datasets locally inside your browser sandbox, you get instant statistical power with zero cloud vulnerabilities.”
1. The Dilemma of Modern Spreadsheet Analytics
Every data analyst, business owner, and digital marketer encounters common spreadsheet pain points on a weekly basis:
- Structural Parsing Errors: Generic CSV parsers split fields whenever they encounter natural commas inside quoted strings (e.g., addresses like “Austin, TX” or product names). This corrupts columns and misaligns table structures.
- Severe Data Quality Issues: Real-world exports are riddled with duplicate rows, messy whitespace, missing values, and corrupted data types.
- Misleading Statistical Means: When executive teams evaluate sales or revenue based solely on the arithmetic Mean, extreme enterprise transactions pull the numbers upward, hiding the actual performance of the typical customer.
- Security and GDPR Vulnerabilities: Uploading internal company metrics, patient rosters, or billing records to cloud SaaS tools violates data sovereignty regulations.
You can experience a faster, safer approach right now using the In-Browser AI CSV Analyzer on RiazHub.com.
2. Key Architecture: 100% Client-Side Ingestion and Profiling
The AI CSV Analyzer and Profiler operates on a deterministic, client-side architecture powered by the HTML5 FileReader API, ES6+ vector processing, and the HTML5 Canvas 2D engine. Here is what powers this tool under the hood:
A. RFC-4180 Multi-Ingestion Pipeline
The ingestion engine features a robust finite state-machine parser complying strictly with the RFC-4180 specification. It correctly handles double-quote encapsulation, embedded line breaks within text cells, and escaped quotation marks (“”VIP Customer””). The tool also includes automated delimiter detection, identifying whether your file relies on commas (,), semicolons (;), tabs (\t), or pipes (|) with no manual configuration required.
B. Automated Column Statistics Matrix
Once loaded, the engine immediately profiles every single column and determines whether it represents numeric metrics, text categories, dates, or booleans. For each column, it calculates:
- Cardinality and Completeness: Non-null counts, missing cell percentages, and unique value counts.
- Central Tendencies: Arithmetic Mean, 50th Percentile Median (P50), and Total Sum.
- Dispersion and Spread: Minimum and Maximum bounds, Standard Deviation (sigma), and Interquartile Range (IQR).
- Top Frequent Values: Mode occurrences and categorical representation shares.
C. Plain-English AI Executive Takeaways and Anomaly Synthesizer
Raw numbers alone do not tell a story. The built-in AI synthesizer translates mathematical distributions into natural-language business summaries:
- Strategic Executive Snapshot: A concise assessment of total records, dimensions, and overall data health.
- Skewness Alerts: Highlights columns where the arithmetic Mean significantly diverges from the Median (over 15%), explaining whether high-value whales or low-end drag dictate the numbers.
- Statistical Outlier Warnings: Identifies records breaching 1.5x IQR boundaries or 2.5 standard deviations, flagging specific transaction amounts for executive review.
- Market Share Leadership: Discovers the dominant categories driving business volume.
Analyze Your Spreadsheet in Seconds
Drop your CSV file into the browser or load a realistic sales preset to uncover instant insights with zero server uploads.
3. Interactive Visual Chart Studio and Data Cleaner
Beyond statistical matrices, the Visual Data Intelligence Studio provides two essential operational hubs:
High-DPI HTML5 Canvas Chart Studio
Visualizing data trends does not require installing bulky charting packages. The native HTML5 Canvas 2D engine renders four interactive chart formats at full Retina and 4K resolution:
- Vertical Bar Chart: Compares discrete categories aggregated by Sum, Average, or Count with value callouts and gradient fills.
- Line Trend Chart: Illustrates chronological trajectories and metrics across time periods with smooth Bezier curves and fill shading.
- Doughnut / Pie Distribution: Highlights market share percentages with an inner cutout summary and color-coded legend.
- Scatter Correlation Plot: Maps two quantitative variables against each other to reveal correlation patterns.
Every chart can be exported instantly as a high-resolution PNG graphic stamped with the official RiazHub verification watermark.
One-Click Data Quality & Transformation Deck
Dirty data ruins downstream machine learning and business reporting. The integrated cleaning deck provides one-click sanitization:
| Cleaning Action | Operation Performed | Primary Use Case |
|---|---|---|
| Remove Duplicates | Prunes identical rows across all attributes | Eliminates double-billed orders or repeated log entries |
| Trim Whitespace | Strips leading, trailing, and redundant internal spaces | Normalizes categorical labels for accurate grouping |
| Drop Empty Rows | Deletes rows containing zero content | Removes blank spreadsheet lines left by system exports |
| Fill with Mean / Median | Imputes missing numeric cells with column average or P50 | Prepares continuous features for statistical modeling |
| Fill with Zero | Substitutes blank numeric cells with 0 | Resolves unrecorded transactions or zero-unit orders |
4. Multi-Format Branded Export Pipeline
Once your dataset is profiled and cleaned, the RiazHub CSV Intelligence Studio allows direct 1-click downloads across five distinct formats, each automatically branded:
- Cleaned CSV Dataset (.csv): Download the sanitized, deduplicated dataset ready for import into business systems.
- Executive Markdown Audit Report (.md): A complete structured summary including KPIs, column matrices, and AI anomaly takeaways.
- JSON Dataset Array (.json): A ready-to-use array of key-value objects for web developers and API integration.
- SQL Database Script (.sql): Automatically generates the
CREATE TABLEschema andINSERT INTOqueries for rapid relational database ingestion. - Print / PDF Audit Sheet: A clean, white-background print layout formatted for executive review and compliance archiving.
5. The Data Science Corner: Why Median Trumps Mean in Real-World Data
One of the most valuable aspects of the AI CSV Statistical Profiler is its automatic skewness detection. In introductory statistics, students learn that the arithmetic Mean represents the average. In business reality, however, the Mean is frequently deceptive.
Consider an e-commerce store with 10 orders: nine customers purchase items worth $40, while one enterprise client makes a bulk purchase of $8,000. The arithmetic Mean is $836, yet not a single customer spent anywhere near $836. Relying on the Mean would cause management to set unrealistic target margins and misjudge advertising ROI. The Median, by contrast, is $40: an accurate reflection of standard customer engagement. Whenever our tool detects that the Mean exceeds the Median by over 15%, it flags a positive skewness alert, guiding leadership to base forecasts on median realities.
6. 100% Client-Side Privacy: Why Zero Server Uploads Matter
Corporate data leaks often happen not through external malicious hacks, but through casual uploads to unauthorized online utility websites. When employees upload customer lists or quarterly revenue spreadsheets to generic online CSV converters, those files can be cached, indexed, or stored on third-party cloud servers.
The Universal AI CSV Analyzer Studio on RiazHub.com executes every computation in browser RAM. Your data never touches an external server, database, or remote AI model. You can safely profile medical datasets, financial records, and confidential user rosters with complete peace of mind.
Experience Fast, Secure In-Browser CSV Intelligence
Inspect, profile, clean, and visualize your spreadsheets now with the ultimate privacy-first analytical suite.
⚡ Universal AI CSV Analyzer & Data Studio
Upload or paste any CSV/TSV file to uncover instant statistical profiling, detect missing values and outliers, clean messy records, render interactive Canvas charts, and export structured datasets 100% locally in your browser.